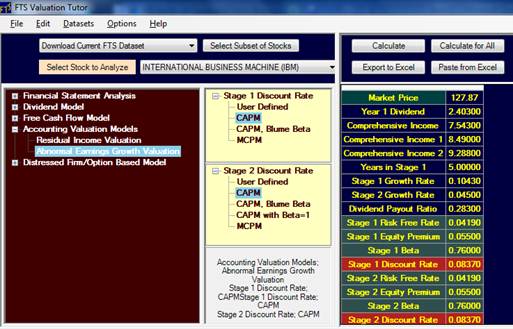
9.8 Entering Data via Excel
First click on the button Export to
Excel to create a template, and then overwrite these values
in Excel and copy and paste from Excel back to Valuation tutor.
You can then save the Excel workbook.
Working with Excel and Valuation Tutor Using the “Best Method
for Entering Data”
Step 1:
All labels have to be exactly as the labels on the
screen. So first
click on the button “Export to Excel” this will immediately
create your Excel template:

Step 2:
Edit the numbers above directly in Excel with the numbers
from the current example:
Note the numbers in red in the previous Valuation Tutor screen
are automatically derived and do not need to be changed.
The current example’s numbers are:
Dividend per Share
= Dividends/Shares issued = 2,860/1341 = $2.132 equals the
dividend per share.
Year 1 Dividend (Forward Annual Dividend) = 2.403
Dividend Payout Ratio (Relative to Comprehensive Earnings) =
2860/10115 = 0.283
Comprehensive Earnings per share 2009 = $10,115/1341 =
$7.543
Expected Comprehensive EPS FY 2010
$7.543*1.1255 = $8.49
Expected Comprehensive EPS FY 2011
$8.49*1.094 = $9.288
Years in Stage 1:
5-years
5-Year Growth =
0.1043
Normal Growth = 0.045
Projected Dividend Per Share (Next Year) = $8.49*0.283 =
$2.403
Inputs for Cost of Equity Capital (CAPM)
Risk Free Rate = 0.0419
Equity Premium = 0.055
Beta (IBM) = 0.76
Derived (Don’t Enter):
Cost of Equity Capital (ke) = 0.0837
Entering the above into Excel yields:

Step 3:
Copy the first two columns from row 2 (i.e., include the
stock name) to Row 20 in Excel above, into the windows clipboard
and then click on the Valuation tutor button Paste from Excel to
generate the following screen:


For this first pass the AEG assessment is that IBM is either
currently undervalued at $127.87 or its cost of capital is
higher (= 0.1144).
Verifying the
Calculations for Intrinsic Value
By double clicking on the name above International Business
Machine in the Abnormal Earnings Growth Model’s analytical
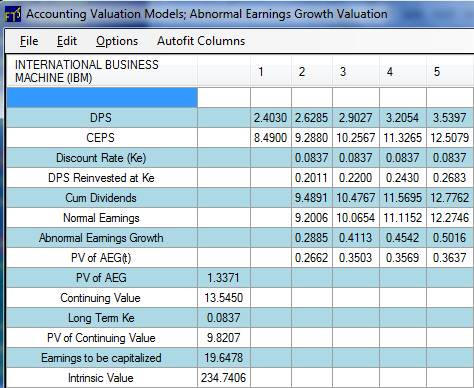
support reveals the following grid:
After clicking “Calculate” you also see the intermediate
calculations:

Support for Above Numbers
1=2010, 2=2011, 3=2012, 4=2013, 5=2014
DPS equals projected Dividends per share.
Here 2.403 = Dividend payout ratio times the
Comprehensive Earnings per share for 2010 (8.49), and so on for
2011 etc.,.
CEPS for years 2012, 2013 are respectively 9.288*1.1043,
10.2567*1.1043 ….
DPS Reinvested at Ke = Opportunity cost associated with the
dividends per share.
For 2011 = 2.4030*0.0837 and so on.
CEPS Cum Dividends = Comprehensive Earningst
+ ke * Dividendst-1
For 2011 this equals 9.2880 + 0.2011 = 9.4891 and so on.
Normal Earningst = (1+Cost of Equity
Capital)*Comprehensive Earningst-1
For 2011 this equals 8.49*1.083 = 9.2006, 2012 = 9.288*1.0837 =
10.0654 and so on.
Abnormal Earnings Growth = Cum-Dividend Comprehensive Incomet
– Normal Earnings t = (Earningst +
(ke*Dividendst-1) – (1+ke)*Earningst-1 =
9.4891 – 9.2006 = 0.2885 for 2010 and so on.
The time value of money now uses the discount rate each year
equal to the cost of equity capital (0.0837).
The total earnings to be capitalized (19.6478) consist of three
components at the end of 2010:
Earnings2010 + PV2010 Abnormal Earnings
Growth + PV2010 Continuing Value
Aside: Continuing
value is the value under normal growth for years greater than
year 5. In year 5
this is:
0.5016*(1+0.045)/(0.0837 – 0.045) = 13.545.
Finally this is discounted back to present (beginning of
2010) (13.545/(1.0837^5) = 9.8207
Earnings to be capitalized = 8.49 + 1.3371 + 9.8207 = 19.6478
Intrinsic ValueBeginning of 2010 = 19.6478/0.0837 =
$234.74
